SiteWatch 360 support includes regular data-reviews to ensure sites are operating as expected and data flows are reliable and consistent. For M&V applications, this support can take different forms:
- Configuration of new sites with equipment and panel details provided
- Guidance on equipment to be monitored for a given energy efficiency project
- Reviewing baseline and post-installation data, setting up analysis workbooks
- Drafting Reports based on customer needs
- Review of other information collected, i.e. variables such as production or occupancy
Capturing energy-use data on machines or systems involved with energy- efficiency projects is key to validating changes resulting in energy savings. Whether controls are upgraded, motors are replaced, or setpoints are modified, measuring energy-use prior to, and after a project is implemented, is key to understanding whether the change saved energy and, if so, how much.
With remote monitoring, M&V consultants or utility companies can determine if projects are saving as expected and advise customers if they are not. Additionally, a temporary installation can be converted to a permanent installation at the request of the customer, with no additional configuration!
Tariff Engine
Most monitoring systems use a fixed price per kWh for calculating equipment operating costs (e.g., 10.6 cents per kWh). For much greater accuracy, SiteWatch 360 can adjust costs for…
- Total kWh usage (typically 2/3 of the power bill)
- Peak Demand (kW) charges (typically 1/3 of the power bill)
- On-peak rates, Off-peak rates, and Mid-peak rates
- Generation, Transmission and Distribution charges
- "Other" charges (e.g., energy efficiency charges, state and other taxes)

Each customer's tariff is entered manually into the SiteWatch 360 software platform and should be revised once a year when new charges are typically calculated by the utility companies.
Inputting the tariff correctly can make a substantial difference to the real cost of running any piece of equipment, compared with using a flat rate of X cents/kWh.
Case Study
In our M&V case study, a mechanical contractor used SiteWatch 360 to complete verification of an HVAC fan VFD installation. With our support, the contractor calculated baseline annual energy use, discovered the measure was underperforming midway through the performance period, and made additional control changes to ensure the project saved energy in line with expectations. Without SiteWatch 360 support, the project would not have met its targets.
View the Full Case StudyStep 1. The baseline period shows the supply fan (blue line) and return fan (orange line) operating continuously – i.e. not following the load. (The dotted green line is the outside temperature feed.)
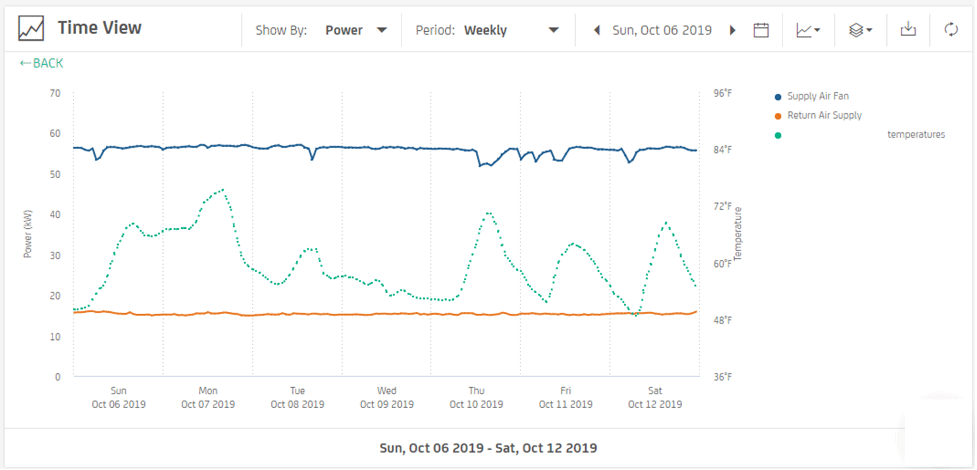
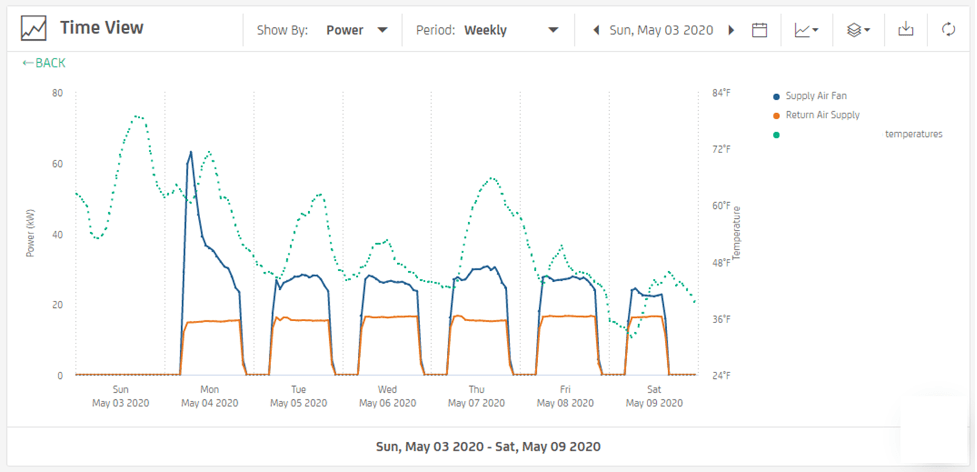
Step 2. After installation of VFDs and controls, the fans started to shut down during unoccupied periods, overnight and on Sundays, with some reduction in energy use during lightly-occupied periods. The initial VFD settings did not allow the fans to reduce operations sufficiently. With active monitoring through a remotely accessed platform, the contractor was made aware of the underperformance quickly rather than waiting for months.
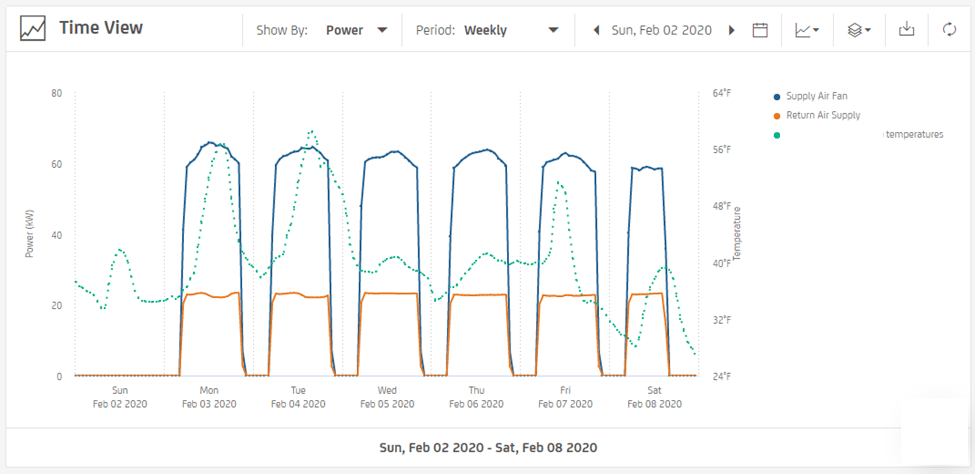
Step 3. SiteWatch 360 worked with the contractor to ensure additional changes to control setting resulted in fan energy reductions in line with original expectations.